Modeling MLB Wins
STAT 410 Linear Regression Final Project | Written by Theo Au-Yeung, J. Dante Maurice, Andersen Pickard
In the modern era of baseball analytics, understanding the driving forces behind team success necessitates a multifaceted approach that considers performance across the three facets of the sport: batting, pitching, and defense. This project aims to develop predictive models for Major League Baseball (MLB) team wins using data from the 2022 and 2023 seasons, with the goal of predicting 2024 wins by applying our model to the 2024 data. Leveraging a combination of linear regression and principal component analysis (PCA), we construct composite scores that reflect team-level performance in each major phase of the game.
Presently, the majority of baseball discourse focuses on new-age analytics, and we are very aware of the credibility that modern analytics and metrics possess, especially when evaluating player talent and performance. However, we aim to determine whether modern analytical measures are sufficient in predicting team performance. After all, individual player-by-player outcomes are only so valuable; ultimately, there is no better way to quantify team success than by win totals, which lead to playoff success and a potential World Series title.
Before exploring the data, we conducted brief background research to supplement our existing understanding of baseball analytics. We read “Baseball Analytics” from the Catapult website to gain a better understanding of the advanced analytics currently being used and their applications. One of their primary functions is to conduct proper player evaluation. We also read “Stats to Avoid: Batting Average” by Neil Weinberg on FanGraphs to learn more about why the batting average statistic has fallen out of favor. The answer is that batting average only tells us how good a player is at getting on base via a base hit, but it leaves out important context such as how many bases they totaled, where the defense was positioned, and much more. Other metrics are preferred because they provide more information and context. With this additional background research, we are confident that we have a well-defined problem to solve, as we are testing whether advanced analytics are indeed effective in predicting team performance.
Feature Selection
Our analysis began with team-level data scraped from FanGraphs. For each team across the 2022 and 2023 seasons, we compiled separate datasets for batting, pitching, and defense, choosing features that are both widely accepted as predictive of team performance and rich in underlying baseball insight. In the batting model, we prioritized metrics that reflect plate discipline, batted ball quality, and overall offensive approach. These included variables such as BB% (walk rate), K% (strikeout rate), Hard Hit%, Launch Angle, O-Swing%, and Z-Swing%, among others. These features were selected for their ability to quantify how often and how well teams make contact, as well as their tendencies in the strike zone. We initially included Contact% and Barrel%, but due to issues with multicollinearity, we decided to remove both.
The graph above displays our selected features, which provide a balance of characteristics that are not overly collinear and offer unique perspectives on our research topic that we wish to explore.
For the pitching model, we included stats that measure both outcome-based and process-based performance, such as F-Strike% (first pitch strike rate), CSW% (Called Strike + Whiff %), LOB% (left on base %), Hard Hit%, Launch Angle, and traditional indicators like K/9, HR/9, and BB/9. We avoided features like ERA and FIP, which summarize overall performance too closely with win outcomes, to prevent multicollinearity. We also initially included GB% (ground ball%) and Contact%, but we found that these variables were highly collinear with some of our other variables, so we removed them.
For the pitching model, we included stats that measure both outcome-based and process-based performance, such as F-Strike% (first pitch strike rate), CSW% (Called Strike + Whiff %), LOB% (left on base %), Hard Hit%, Launch Angle, and traditional indicators like K/9, HR/9, and BB/9. We avoided features like ERA and FIP, which summarize overall performance too closely with win outcomes, to prevent multicollinearity. We also initially included GB% (ground ball%) and Contact%, but we found that these variables were highly collinear with some of our other variables, so we removed them.
To synthesize these variables into a single interpretable metric per phase of the game, we constructed a “score” for batting, pitching, and defense using linear regression coefficients as weights. Each score was generated by training a model to predict team wins using only the respective domain’s features (e.g., batting-only model for batting score), then multiplying the standardized features by the model coefficients to produce a composite. We scaled and rescaled these scores to make them comparable across teams and years.
This allowed us to evaluate the contribution of each component to team success and build a final model that predicted team wins using only these three scores, effectively creating a modular and interpretable system for quantifying overall team quality.
Batting Score
This chart illustrates the standardized coefficients from our batting model, revealing the relative importance of each offensive metric in predicting team wins. ISO (Isolated Power) and BB% (Walk Rate) emerge as the most positively influential variables, underscoring the value of power hitting and plate discipline in driving offensive success. Conversely, K% (Strikeout Rate) has the largest negative impact, suggesting that teams with high strikeout rates are at a significant disadvantage. Metrics like Hard Hit% and O-Swing% also contribute positively, indicating that quality contact and a disciplined approach at the plate are beneficial. Overall, the results highlight the importance of an efficient, power-oriented offense with a reduced number of strikeouts.
Highest Team Batting Scores:
2022-2023 MLB Seasons
This table highlights the top 10 team batting scores from the 2022 and 2023 MLB seasons, showing a clear correlation between offensive output and win totals. The 2023 Braves top the list with a massive batting score of 278 and 104 wins, exemplifying how elite offense drives team success. The Dodgers appear twice, and the 2022 Yankees, boosted by Aaron Judge’s 62-home-run season, also rank highly. World Series winners, such as the 2022 Astros and 2023 Rangers, further support this connection. However, a few outliers emerge: the 2023 Padres ranked 7th in batting score but managed only 82 wins, hinting at weaknesses in pitching, defense, or clutch performance. Similarly, the 2023 Cardinals posted a top-10 batting score yet won just 71 games, likely due to broader team deficiencies. These exceptions underscore that while offense is crucial, balanced performance across all phases is key to sustained success.
Pitching Score
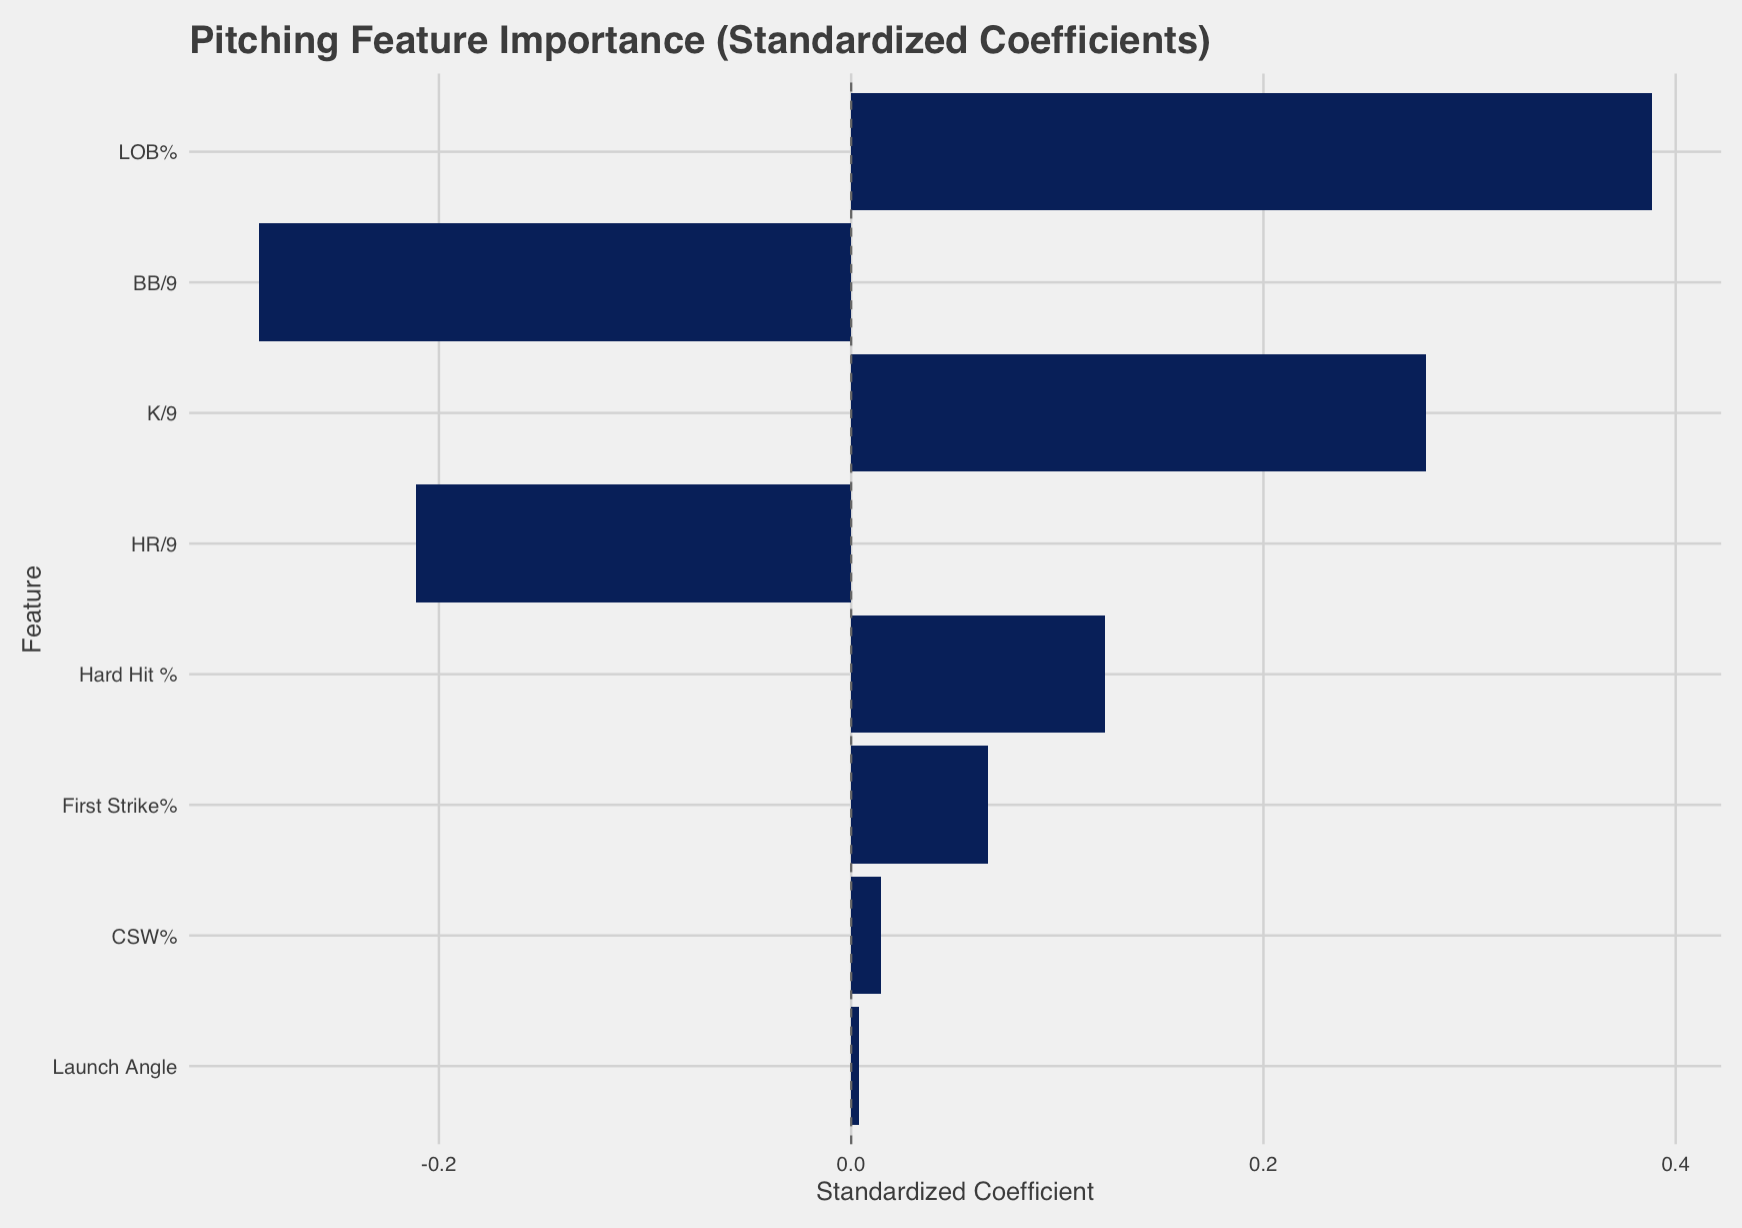
The chart upove illustrates which pitching metrics have the most significant influence on team wins, based on standardized coefficients. LOB% is the top positive predictor, highlighting the importance of stranding baserunners before they become runs. BB/9 and HR/9 are strongly negative, emphasizing the need to avoid walks and limit home runs. K/9 stands out as a key positive factor, reflecting the value of strikeouts. Other stats like Hard Hit % and First Strike % contribute modestly. Overall, the model indicates that pitching success is largely determined by command, strikeout ability, and limiting damage.
Highest Team Pitching Scores:
2022-2023 MLB Seasons
This table showcases the top 10 team pitching scores from the 2022 and 2023 MLB seasons, and overall, it supports a strong correlation between elite pitching performance and high win totals. The 2022 Dodgers, who posted an MLB-best 111 wins, top the list with a dominant pitching score of 206. They are followed closely by the 2022 Mets and 2022 Astros, both of whom also exceeded 100 wins and featured deep, efficient rotations and bullpens, underscoring the value of run prevention.
Several teams in the top 10 had strong win totals that align with their pitching strength, such as the 2022 Braves, 2022 Yankees, and 2022 Blue Jays, all of whom made the postseason. Notably, the 2023 Twins rank 4th in pitching score despite a more modest 87 wins, reflecting a well-pitched but perhaps offensively inconsistent team. Similarly, the 2023 Mariners and 2023 Blue Jays also appear with strong pitching metrics and respectable win totals, but may have been hindered by inconsistent hitting or poor situational play.
Defense Score
The chart above displays the standardized coefficients from the defense regression model, showing which components of team defense most strongly correlate with winning. FRM (Framing Runs) stands out as the most impactful feature, suggesting that catcher framing plays a significant role in run prevention and, consequently, team success. RngR (Range Runs) follows closely, highlighting the importance of defensive range in converting batted balls into outs. ErrR (Error Runs) also has a positive impact, indicating that teams minimizing errors gain a measurable advantage. Meanwhile, DPR (Double Play Runs) and ARM (Outfield Arm Runs) contribute less to the model, suggesting their effects are more situational or less consistent across teams.
Highest Team Defense Scores:
2022-2023 MLB Seasons
Upon examining our results, we immediately noticed a weaker correlation between win totals and our defense score compared to our pitching and batting scores. The 2023 Pirates and 2022 Diamondbacks are examples of that, with just 76 and 74 wins, respectively. This lends to the idea that good defense, in most cases, can not compensate for bad hitting and bad pitching.
2024 Predictions
To predict 2024 wins, we combined all three of our performance metrics—batting, pitching, and defense—by applying the trained model coefficients to the corresponding 2024 features.
Examining the coefficients for each of our scores from the linear model, we observe that pitching is the most indicative of team success. Naturally, teams that can consistently prevent runs throughout the course of the season are most likely to succeed. On the other hand, we find that defense is significantly less predictive of team success, with its 95% confidence interval containing zero, indicating it is an insignificant variable.
When we plotted the actual 2024 win totals against our predicted 2024 totals, we see that our model performed very well, with a correlation coefficient of 0.917.
Testing
Here, we looked at our Breusch-Pagan test results, observing that none of our models – batting, pitching, defense, or win prediction – indicate evidence of heteroscedasticity. Each model displays a p-value greater than 0.05, indicating that we fail to reject the null hypothesis of constant variance in our residuals.
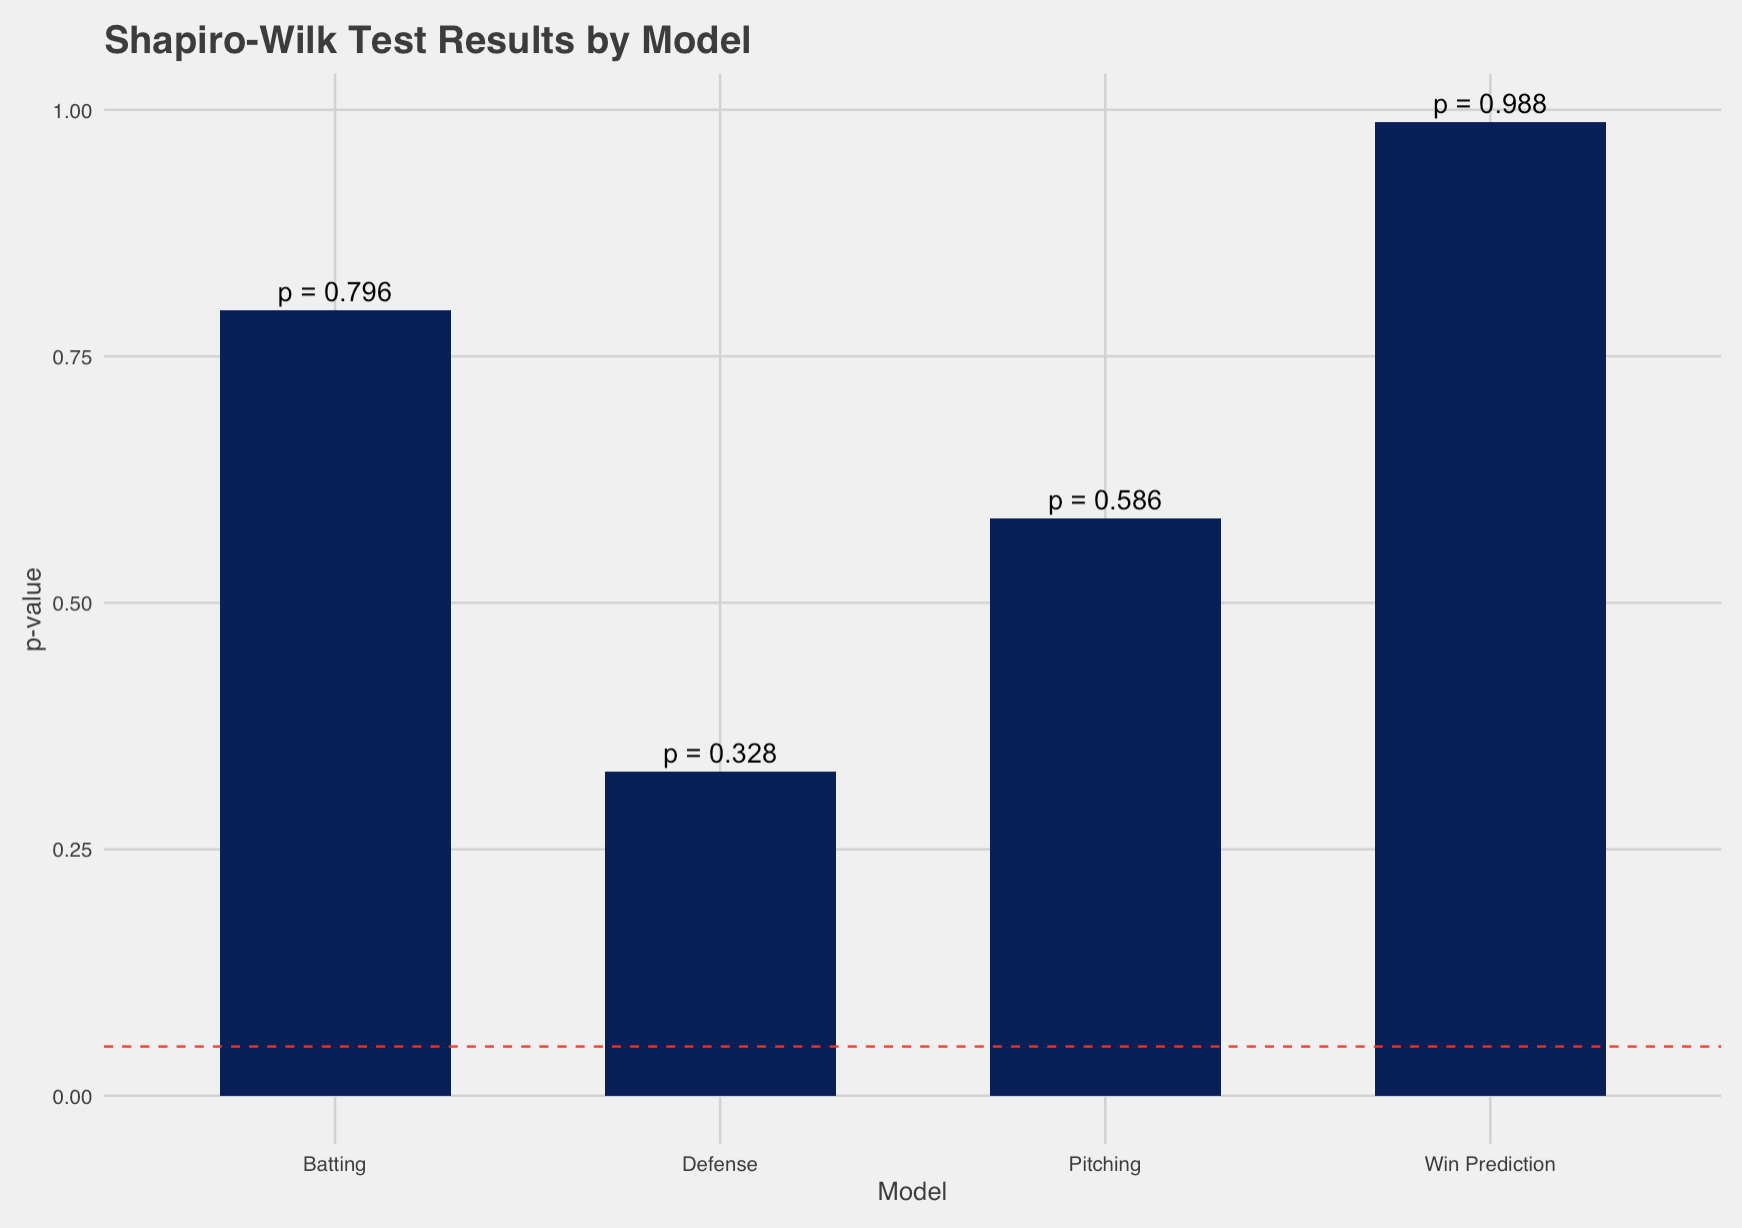
This chart presents the Shapiro-Wilk test results for normality of residuals across the four models, all of which show p-values well above the 0.05 threshold (marked by the red dashed line). This indicates that we fail to reject the null hypothesis in each case, suggesting that the residuals are approximately normally distributed.
Summary and Discussion
This project built predictive models for MLB team wins using 2022–2023 data to predict 2024 win totals, incorporating batting, pitching, and defense scores to quantify team quality. The batting model highlighted ISO and BB% as the strongest positive contributors, while K% was the strongest negative, reinforcing that power, plate discipline, and limiting strikeouts drive success. The pitching model revealed LOB% as the most influential positive metric, with BB/9 and HR/9 being the most harmful, showing that stranding runners is crucial. Defensively, FRM and RngR were significant, though defense overall had less impact than offense or pitching. Combining these three components into a composite score produced a strong correlation (0.917) between predicted and actual 2024 wins, validating the approach.
The findings carry important applications for front offices and managers, offering a framework for roster construction, trades, and in-game decisions based on which metrics most influence wins. For example, emphasizing relievers with strong LOB% could improve late-game outcomes. Future directions include refining feature selection, testing additional metrics, and addressing multicollinearity concerns, as well as shifting from metrics to player types to tackle broader questions like lineup optimization, the value of specialists, or balancing catcher offense and defense. Despite limitations, the models effectively forecast team win totals and provide actionable insights for both season-long and game-level strategies.


